
Academia - Analíticas de Academia
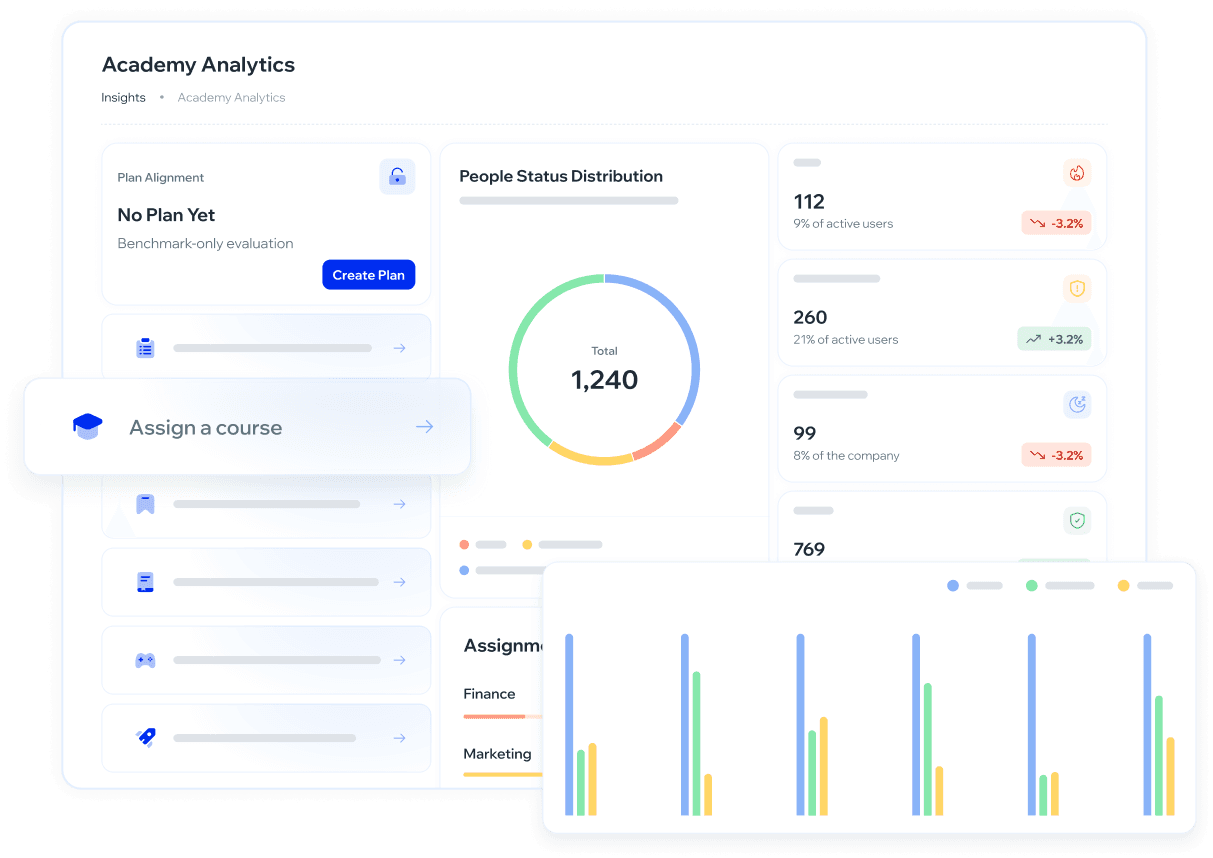
El dashboard de Analíticas de Academia ofrece una visión integral del estado de capacitación de tu organización, mostrando riesgo, progreso y cobertura de asignaciones en un solo panel.
¿Para qué sirve?
Visualizar el estado general del programa de capacitación de tu organización.
Identificar usuarios En riesgo, Necesita atención, Al día o Sin capacitación asignada.
Analizar la evolución del programa respecto al período anterior.
Detectar brechas de capacitación por departamento, grupo o a nivel de toda la compañía.
Tomar decisiones estratégicas basadas en datos y actuar desde el mismo panel.
¿Cuándo usar esta vista?
Usa Analíticas de Academia cuando quieras responder preguntas como:
¿Cuántos colaboradores tienen formación vencida hoy?
¿Qué departamentos tienen menor cobertura de capacitación?
¿El programa mejoró o empeoró respecto al mes anterior?
¿Hay colaboradores activos que nunca recibieron formación?
Es especialmente útil antes de auditorías, presentaciones a liderazgo o cuando quieres priorizar a quién asignar formación primero.
¿Cómo interpretar los resultados?
Distribución del estado de las personas
Muestra a todos los usuarios activos clasificados en cuatro estados. El color de cada uno es el mismo en el gráfico de dona y en la etiqueta de la tabla de abajo:
🔴 En riesgo (rojo) — tienen cursos o rutas de aprendizaje con fecha vencida. Priorizar: asignar formación o enviar recordatorio.
🟡 Necesita atención (amarillo) — tienen formación pendiente, con el plazo todavía vigente. Monitorear; actuar si se acerca el vencimiento.
🟢 Al día (verde) — completaron todas sus asignaciones activas. Sin acción requerida.
🔵 Sin capacitación asignada (azul) — activos pero sin ninguna formación asignada. Evaluar si corresponde asignarles formación.
Nota: Cada tarjeta de estado es interactiva. Al hacer clic (o presionar
Enter/Espaciocon la tarjeta enfocada medianteTab) se navega automáticamente al Registro de auditoría, filtrado por ese estado.
Cobertura de asignación
Muestra qué porcentaje de usuarios con formación asignada la completó. Se puede ver agrupada por Grupo, por Departamento o a nivel de Compañía. Un departamento con cobertura baja es una brecha concreta que requiere acción.
¿Cómo se calcula la cobertura? Solo se consideran los usuarios que tienen formación asignada.
Fórmula: Cobertura = Usuarios con cursos completados ÷ (Usuarios activos − Usuarios sin asignaciones)
Ejemplo: 5 usuarios activos, 1 sin asignaciones, 2 con formación completa → 2 ÷ (5 − 1) = 50% (no 40%).
Esto garantiza una medición justa del cumplimiento real.
Las barras vienen ordenadas de mayor a menor riesgo, y al pasar el cursor sobre una se muestra la cantidad de empleados de ese grupo. Si no hay datos para lo que estás mirando, el bloque muestra «No hay datos disponibles».
Comparación con el período anterior
Al activar el toggle Último período, cada métrica muestra si mejoró o empeoró respecto al período previo, y las barras de cobertura suman su propia variación. Úsalo para detectar tendencias antes de que se conviertan en problemas.
Los porcentajes reflejan únicamente usuarios activos. Los usuarios sin asignaciones no afectan el porcentaje de cobertura.
¿Cómo se usa?
Navegación: Insights → Analíticas de Academia → Academia
En el menú lateral, Analíticas de Academia está dentro de la sección Insights, y se despliega en cuatro pantallas: Academia (esta), Cursos, Rutas de Aprendizaje y Chequeos rápidos.
Ingresa a Insights → Analíticas de Academia → Academia.
La primera vez que entras se abre un tour guiado que recorre las partes del tablero. Puedes saltearlo, y no vuelve a aparecer.
Activa el toggle Último período para comparar las métricas actuales con el período anterior.
Usa el botón Filtros para segmentar la información. El panel tiene el rango de fechas y tres campos:
Departamento
Grupos
Curso — acota el tablero a uno o varios cursos puntuales.
Ojo con el filtro de Curso: si eliges varios, la cobertura solo cuenta a quien los tenga todos asignados. Si ningún grupo cumple esa condición, el bloque avisa que ningún grupo tiene un miembro asignado a todos los cursos seleccionados y te sugiere cambiar la selección. No es un error: es que el cruce quedó vacío.
Analiza las métricas principales del dashboard:
Distribución del estado de las personas: la cantidad de usuarios activos en cada uno de los cuatro estados.
Cobertura de asignación: permite detectar áreas con brechas de capacitación, por Grupo, Departamento o Compañía.
Al hacer clic en cualquiera de las tarjetas de estado, la página baja automáticamente a la tabla de Registro de auditoría, ya filtrada por ese estado. El filtro queda reflejado en la URL con el nombre interno del estado —
?status=at_risk,?status=needs_attention,?status=up_to_dateo?status=not_trained—, así que puedes copiar y compartir el link: quien lo abra verá la tabla filtrada y posicionada en esa sección. El período que tengas seleccionado se mantiene al aplicar el filtro por estado.Una vez identificado un riesgo o brecha, usa las Acciones rápidas del panel lateral para actuar sin salir del dashboard:
Registro de auditoría de cursos
Registro de auditoría de rutas de aprendizaje
Asignar un juego
Asignar un curso
Asignar una ruta de aprendizaje
Para exportar el dashboard, elige el formato que necesites: PDF, PNG o JPEG.
Las Acciones rápidas te permiten pasar del análisis a la acción sin cambiar de pantalla.
Registro de auditoría del historial de la Academia
Debajo del dashboard vas a encontrar una tabla con una fila por empleado, que muestra su estado de formación (calculado por el sistema) y cuánto completó de cada tipo de contenido.
Por defecto, la tabla muestra las columnas: Empleado, ID, Estado, Trivias, Cursos y Rutas de aprendizaje.
Estado se muestra como una etiqueta de color: En riesgo (rojo), Necesita atención (amarillo), Al día (verde), Sin capacitación (azul).
Para filtrar por estado, usa el dropdown Estado y elige uno. También hay filtros de Departamento, País y Grupos. Cada filtro que actives aparece como un chip removible arriba de la tabla.
El filtro de Estado de la tabla está sincronizado con la URL: si llegas desde una tarjeta del dashboard o desde un link compartido, la tabla ya aparece filtrada. Al limpiar el filtro, la tabla vuelve a mostrar todos los estados y el botón Atrás del navegador sale limpio de esa pantalla.
Los filtros del encabezado de Academia (por ejemplo, el período) también se aplican a esta tabla.
Puedes buscar por nombre de empleado con el buscador.
Puedes ordenar la tabla por Empleado, Trivias, Cursos o Rutas de aprendizaje. El resto de las columnas no es ordenable.
La vista anterior de Analíticas de Academia fue reemplazada por este dashboard. El detalle por inscripción y por curso que ofrecía la vista anterior sigue disponible desde las Acciones rápidas (Registro de auditoría de cursos / Registro de auditoría de rutas de aprendizaje).
Desde Columnas puedes mostrar u ocultar casi todas: ID, Estado, Rol, Departamento, Grupos, País, Trivias, Cursos y Rutas de aprendizaje. La única que no se puede ocultar es Empleado.
De esas, Rol, Departamento, Grupos y País arrancan ocultas y las activas cuando las necesitas; el resto viene visible.
Grupos se muestra en un popover con las iniciales de cada grupo.
Si un empleado no tiene país cargado, ves "N/A".
Desde Exportar CSV puedes descargar el archivo
academy-audit-log.csv, que respeta el estado y los filtros que tengas activos en ese momento. Además de los totales por empleado, el archivo incluye tres columnas con el detalle de lo completado: Trivias completadas, Cursos completados y Rutas de aprendizaje completadas, con los nombres separados por coma. Los cursos completados dentro de una ruta de aprendizaje se muestran comoCurso (LP: Ruta). Solo se listan contenidos completados (no lo asignado, en progreso o vencido).
Si no hay resultados para los filtros aplicados, la tabla muestra un estado vacío indicando que ajustes los filtros o la búsqueda.
❓ Preguntas frecuentes
¿Qué diferencia hay entre "En riesgo" y "Necesita atención"?
"En riesgo" son usuarios con cursos ya vencidos. "Necesita atención" son usuarios con formación pendiente pero cuyo plazo todavía no venció.
¿Qué significa "Al día"?
Son los usuarios que completaron todas sus asignaciones activas.
¿Qué incluye "Sin capacitación asignada"?
Usuarios activos que no tienen ningún curso o ruta de aprendizaje asignada.
¿Dónde encuentro esta pantalla en el menú?
En Insights → Analíticas de Academia. Aunque el contenido sea de la Academia, la pantalla vive en Insights junto al resto de las analíticas, y comparte el desplegable con Cursos, Rutas de Aprendizaje y Chequeos rápidos.
¿Las métricas cambian según el período seleccionado?
Sí. Al activar el filtro de período, el dashboard actualiza las tendencias y comparativas automáticamente.
Filtré por varios cursos y la cobertura me quedó vacía.
Es esperable: al filtrar por más de un curso, la cobertura solo considera a quien los tenga todos asignados. Si nadie cumple esa condición, no hay nada que mostrar. Prueba con un solo curso o con una combinación más chica.
¿Las Acciones rápidas modifican datos históricos?
No. Las acciones impactan en resultados futuros, pero no alteran las métricas pasadas.
¿Puedo exportar la información del dashboard?
Sí. Puedes exportar el dashboard en formato PDF, PNG o JPEG. Además, la tabla de registro de auditoría tiene su propia exportación a CSV, que respeta los filtros activos (ver "Exportar CSV" más arriba).
¿Puedo ver el detalle de los usuarios en cada estado?
Sí, en la tabla de registro de auditoría de más abajo, filtrando por Estado.
¿El CSV exportado incluye todos los empleados o solo los filtrados?
Incluye solo lo que estés viendo en ese momento: respeta el estado y los filtros activos al momento de exportar.
¿Por qué algunas columnas de la tabla están ocultas por defecto?
Rol, Departamento, Grupos y País no se muestran por defecto para mantener la tabla más simple; puedes activarlas desde "Columnas" cuando las necesites. Desde ahí también puedes ocultar casi cualquier otra columna, salvo Empleado.
¿Puedo compartir un link que muestre un estado específico ya filtrado?
Sí. Al hacer clic en una tarjeta de estado, la URL se actualiza con ese filtro. Puedes copiar y enviar ese link: quien lo abra va a ver la tabla de Registro de auditoría filtrada y posicionada automáticamente.
¿Qué información trae el detalle de cursos, trivias y rutas en el CSV?
Por cada empleado, el archivo lista los nombres de los contenidos que completó (separados por coma), no lo que tiene asignado o en progreso. Si un curso se completó dentro de una ruta de aprendizaje, aparece marcado como Curso (LP: Ruta) para diferenciarlo de un curso suelto.
¿Tienes feedback o quieres solicitar mejoras? Háznoslo saber en roadmap.whalemate.com/roadmap